KAGI STAT-Is
Abstract
We present an analysis of the past two seasons of KAGI results. Deck strength, patterns for chain bidding, and set efficacy are considered.
Method
Over the past two KAGI seasons, players were asked to include match and deck details when reporting results. Details include the set and SAS of both decks used, chains bid in game three, whether the winning player's deck won the first two games, and whether the winner played their own deck in the third game.
Along with the league commissioner, our team reviewed this data and explored findings on Bottom of the Beaker episode 51. See references below.
Results
In total, 152 match results were included in this study. This covers all of KAGI 7.0 and all but the top cut of KAGI 8.0.
Our lab's first question was whether more matches ended after two games or three. Across KAGI 7.0 and 8.0 we saw a pretty even split, with 7.0 favoring 2-0 outcomes and 8.0 favoring 2-1.

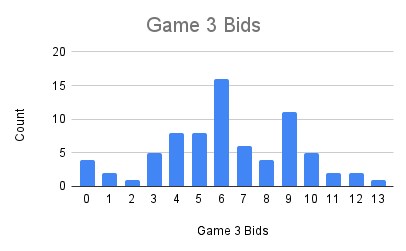
Of the matches that went to three games, what sort of bids were we seeing? This may give us a rough sense for how evenly matches our decks were, as judged by the players, or simply how folks tended to gravitate toward certain bid numbers.
The data shows as decent spread of bids in the 3-10 range, with a significant spike at 6. Perhaps 6 chains is the breaking point for "I agree your deck is a little better, but not too much".
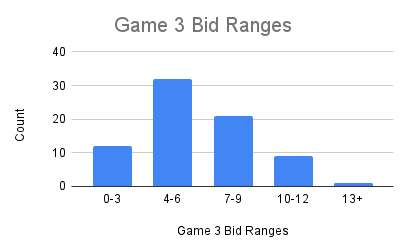
Grouping bids into Binding Iron ranges, tells a similar story. Most players that went to three games thought the decks were within two or three Binding Irons of each other.
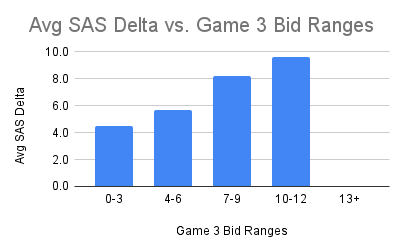
Bids tell us how closely players judged their decks to be. How well does this match SAS's judgement?
We do indeed see the average SAS gap between decks climb as we step up in bid ranges. Is this because the decks have been correctly rated, or are players leaning on DoK to help make sense of the first two games?
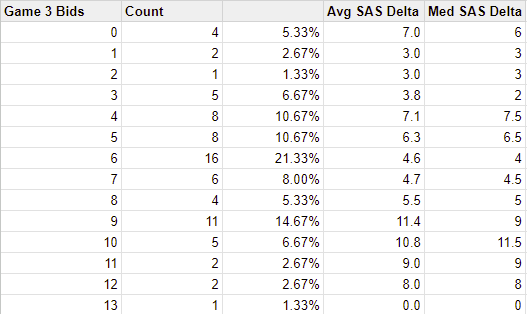
Below we break down the average and median SAS gap between decks in matches that went to three games for observed bid values and ranges.

That's all well and good for three game matches, but what about matches decided in the Newtonian fashion? In fact, there was a slightly larger SAS gap between decks in matches where only two games were required.

Interesting!
For a final look at relative SAS positions, we drilled into various SAS gap buckets to see how many games fell into that range and while still achieving a 2-0 result. Within these groups, we asked how frequently the winning player brought the higher rated deck?

And what about in absolute terms, did folks tend to bring decks with a high or low rating?
The Goldilocks Zone of KAGI appears to be roughly in the 65-75 SAS range. Below we show the percentage splits of the field, for all matches and also with 2-0/2-1 results separated - overall and with winning and losing players isolated.
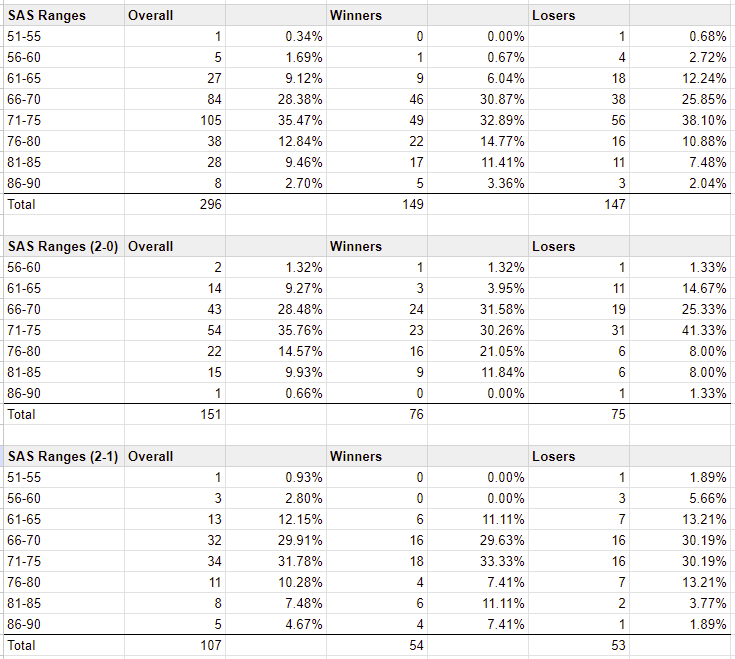
.png)
.png)
.png)
Finally, we turn to the question of set preference and effectiveness. Did the KAGI field tend to favor or ignore any particular sets?
Overall, the mix of sets was fairly evenly distributed across the field as a whole.
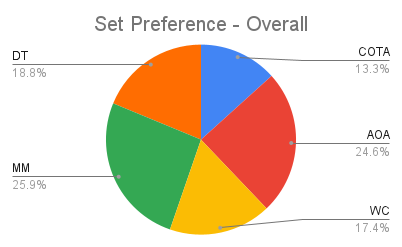
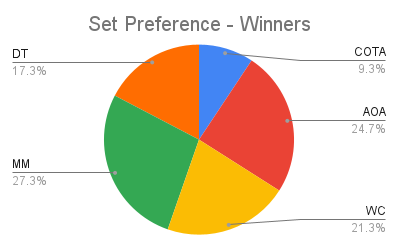
Below, we again show set preference - this time narrowing in on the winning side of each matchup.
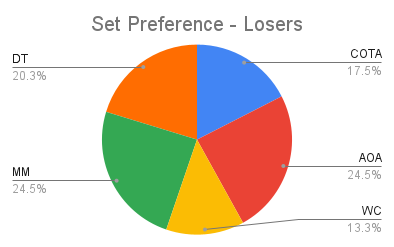
And similarly for match losers.
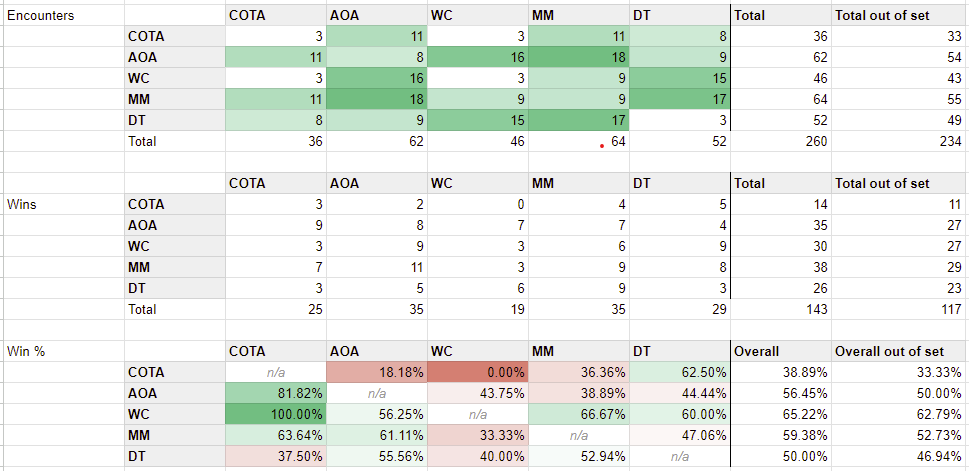
Finally, we present a breakdown of head-to-head set interactions. World's Collide comes out on top as the only set to boast a positive conversion rate when pitted against every other set.
References
- Listen to our discussion with Murph here: https://spotifyanchor-web.app.link/e/QcR0AUFafCb
- See the live recording of discussion of the stats here: https://www.youtube.com/watch?v=D3rSQ8zwxa0
- Check out Murph's Twitch stream for KAGI matches and other great streams: https://www.twitch.tv/fudgenator